Sequencing the campus at the Johns Hopkins University
 A few years ago, the General Biology students at the Johns Hopkins University began to interrogate the unseen world. During this semester-long project, they study the ecosystems of the Homewood campus, and engage in novel research by exploring the microbial ecosystems in different sections of the campus. Biology lab students gather environmental samples from different campus ecosystems, isolate DNA, amplify 16s ribosomal DNA by PCR, and check their PCR results by gel electrophoresis.
 DNA samples are next sent to the university's Genetic Resources Core Facility , where scientific staff, in the DNA Analysis Facility, prepare the DNA templates for sequencing, and load the completed reactions onto an Applied Biosystems 3730 Genetic Analyzer.
The past few years have seen some changes in this process. Data used to be retrieved by logging into an FTP site that allowed anyone to access data from any investigator.
In recent years, this JHU core facility obtained a Geospiza Finch Server, so now, instead of using an FTP site, they upload experimental data, in the form of electropherogram files (aka chromatogram or trace files), into a secure system (the Finch Server) for analysis and delivery. Students can log-in, but now they can only access student data. During the past two years, almost 500 JHU students have logged into the Finch Server to retrieve and view their data.
In the next part of the project, students use BLAST (and our BLAST for beginner's tutorial) to query GenBank at the NCBI and determine which bacterial species were isolated.
All about Phred
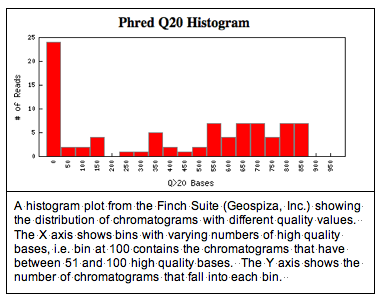
One issue that comes up, though, is the quality of the data. Data quality can be a problem when students do PCR for the first time in a lab class. The image below shows a screen shot from a Finch Server illustrating the distribution of high quality and lower quality data from this year's set of 87 chromatograms.
 You can see from the histogram that about 20% of the chromatograms have fewer than 50 high quality bases. We're defining high quality, as base calls with a Phred score greater than 20. Phred, KB, and TraceTuner are programs that measure the probability of an incorrect base call. A Phred score of 20 corresponds to a 1% chance of a base-calling error.
What this histogram fails to show, though, is how the high quality bases are distributed in a DNA sequence and where they're located. The Finch Suite has programs that will trim poor quality regions of a sequence, but sometimes its still nice to see what your data look like.
I want my FinchTV
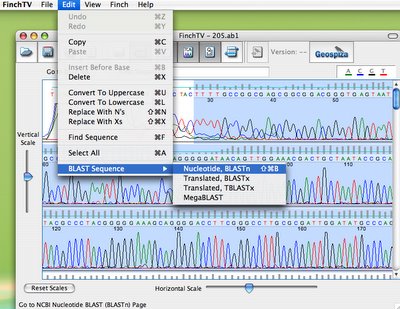
In the next step, students look at their chromatogram data in yet another Geospiza program, available for free, called FinchTV. As you can see, below, they select the high quality region of the sequence, and they can query different databases at the NCBI, just by choosing BLAST sequence.

(Warning potential bias alert: I do work for Geospiza, but I still think this is of cool!).
Through this process, students learn, first-hand, about the diversity of microbial life in the campus all around them and the genetic code that's used to store information in DNA. They also learn about DNA sequence analysis and bioinformatics. Since many of these students plan to attend medical school, this lab serves a critical need in acquainting future doctors with molecular diagnostics.
Both the Finch Server and the core lab staff in the DNA Analysis Facility were important for success of the project. "We never could have done this without the advice and help we got from the people in core lab," said Dr. Rebecca Pearlman, course instructor, "We were able to get our data, talk about quality, and complete a BLAST search in a single class period."
Pearlman adds, "Our students relish the opportunity to do genuine research. They get really excited when they learn they're using the same techniques for bacterial identification that are used by the public health departments."
Of course, I'm writing about this, partly because I get to help out, too. We're making custom BLAST-formatted databanks from each session of the course, so we can do quick comparisons between different data sets, among other things. Over time, these data will allow students at JHU to study changes in bacterial composition from year to year.
And who knows? There are loads of bacteria in every little bit of dirt. What could be cooler than discovering a new species in your first quarter of college biology?
Subject: Classroom Activities
technorati tags: biology, DNA, genomics, microbiology
science education

2 Comments:
What could be cooler than discovering a new species in your first quarter of college biology?
I know what could be cooler: looking at cheek cells through a microscope, and using Benedict's to test for glucose, like we get to do here at Generic Illinois Community College.
Sigh. I guess you really do get what you pay for.
I love that experiment! My biotech students did this same thing, but with a few twists. We diluted our cheek cells in a solution with trypan blue to distinguish living and dead cells and counted the cells in a hemacytometer - to determine concentration.
That's the great thing about biology. There are so many fun things you can do.
Post a Comment
<< Home